Giving presentations - OpenLearn - The Open University

by The Open University

Available in 42 free installments

Owner:

View book

Email address:

Enter your email address above to start receiving your free daily installments.

Dripread will never disclose your email address to third parties.

background colours and text, choose strong colours.

  • Avoid red-green combinations for people who might be colour blind.

  • Use cartoons or line drawings or good photographs.

  • Keep slides to a minimum, perhaps eight to ten for a half-hour talk.

  • Use a common style throughout the presentation.

  • Try building up your slides with less content ?growing? into more content.

  • Number slides and cross reference these to your text notes.

  • Avoid small font sizes.

  • Text simply copied onto an acetate from the printed page often cannot be seen.

  • Avoid putting your whole script on an OHT and then reading it.

  • Never photocopy text from typed script ? it is difficult to read on an OHT.

  • This image shows examples for OHTs. These examples are to be used for the following exercise. There are three rows of two slides. Each row has a specific heading. Under each heading each of the two slides illustrate different types of presenting the same information. On the left hand side is slide A. On the right hand side is slide B. The first row is headed ?Title of Presentation?. Slide A shows a slide containing the main heading ?Rapid Coaches?. Underneath is the sub-heading ?How are we doing??. Underneath this is an image of a bus. Under the image is the name ?Alan Jones?, followed by his job title ?Customer Services Manger?. Slide B shows The title ?Rapid Coaches?. Underneath is a block of text, which reads ?What are the main customer comments about the service on our routes??. Underneath this is the name ?Alan Jones?, followed by the job title ?Customer Services Manager?. The second row is headed ?Analysis of Customer Comments?. Slide A is a shows a line graph. The top of the y-axis is marked one hundred percent. There are three lines on it. The first is one thick line, which shows slight peaks and falls. The second is a dotted line, which start two thirds up the y-axis and drops steeply with a slight peak in the middle. The third is a thin line with starts at the same point as the dotted line on the y-axis, drops steeply, has a small peak, drops again and then has steep rise, followed by a small fall. Slide B is a bar graph. The markings on the y-axis are nought, fifty and one hundred percent. The marking on the x-axis are one, two and three. Each bar has a different colour. Item one rises to almost one hundred percent. Item two rises to around seventy-five percent. Item three rises to about eighty percent. The third row is headed ?The Conclusion?. Slide A contains the title ?The way forward?, followed by the following block of text, which takes up the whole of the rest of the slide; ?We should improve the number of coaches per day and then investigate the possibilities of outside caterers. It is imperative that we set up a working party to look at the problems with luggage and find out why punctuality is such a problem. Remember that our mission statement is to provide a comprehensive service to the majority of the population and to make sure that no-one is disenfranchised?. Slide B is headed ?Conclusion?, followed by four bullet points. The first bullet point reads ?More coaches per day?. The second reads ?Improve catering?. The third reads ?Why is luggage a problem??. The fourth reads ?Can we improve punctuality?? 
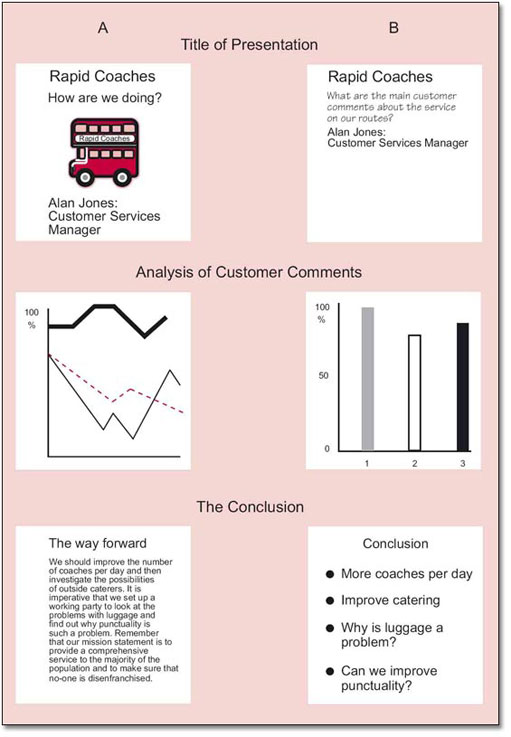
Figure 11: Example OHTs exploring a coach company's performanceLong description

    Activity 11

    Above are three examples of slides or OHTs which have been prepared for a presentation to a coach company meeting of shareholders about customer satisfaction. They are shown in two columns, A and B.